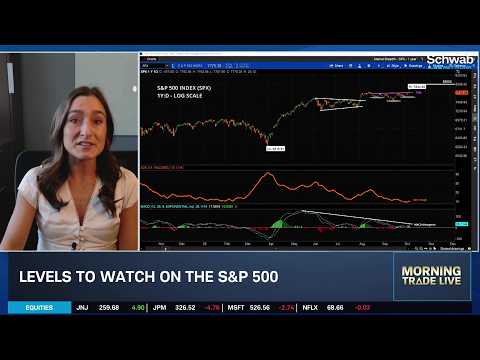
S&P 500

Post Image
US Stock Futures Fall as Strong Economic Data and Higher Treasury Yields Pressure Markets

U.S. stock futures moved lower Thursday after stronger-than-expected manufacturing and labor-market data reinforced expectations that the Federal Reserve may have less room to ease monetary policy, while Treasury yields moved higher.

Dow futures fell 0.56%, Nasdaq 100 futures declined 0.48%, and S&P 500 futures were down 0.23%.

Strong Economic Data Pushes Yields Higher

The Philadelphia Fed Manufacturing Index surged to 47.4 in August, far above the 24.1 forecast and up from 41.4 previously, signaling strong manufacturing activity.

Initial jobless claims also came in stronger than expected, falling to 206,000 from 212,000 versus the 210,000 forecast. Continuing claims increased to 1.799 million, slightly above expectations of 1.790 million.

Following the data, the U.S. 10-year Treasury yield climbed to around 4.702%, up roughly 5.2 basis points on the day.

The combination of stronger manufacturing activity and low layoffs reduces the immediate case for easier Federal Reserve policy, putting upward pressure on bond yields and weighing on equities.

Technology and other rate-sensitive stocks are particularly exposed to rising yields, contributing to the decline in Nasdaq futures. Markets will now assess whether the latest economic strength leads investors to further scale back expectations for future Fed rate cuts.
Health Care and Consumer Stocks Lead U.S. Market as Technology Lags

U.S. equities remained broadly higher Wednesday afternoon, but sector performance showed a sharp divergence, with health care surging while technology and industrial stocks remained under pressure.

The S&P 500 was up about 0.32% as of 2:38 p.m. ET, supported by strong gains in health care, consumer discretionary, consumer staples and materials.

Moderna Cancer Vaccine Breakthrough Fuels Health Care Rally

Health care was by far the strongest S&P 500 sector, jumping 3.59%, with a major catalyst coming from Moderna and Merck’s positive late-stage cancer-treatment results.

Moderna shares more than doubled after the companies reported that the personalized mRNA cancer therapy intismeran, when combined with Merck’s Keytruda, reduced the risk of melanoma recurrence and spread compared with Keytruda alone. Merck shares also jumped about 10%, while the news sparked a broader biotechnology rally. The Nasdaq Biotechnology Index climbed more than 4%, with BioNTech and other mRNA-related stocks also advancing sharply.

The results are particularly significant because they provide late-stage evidence that Moderna’s mRNA technology could have substantial applications beyond infectious-disease vaccines, improving sentiment toward the broader biotechnology industry.

Consumer discretionary was the second-strongest S&P 500 sector, rising 1.93%, followed by consumer staples at 1.46% and materials at 1.29%. Communication services gained 0.65%, while real estate advanced 0.52%.

Treasury Support Helps Broader Market

The broader improvement in sentiment also follows the Treasury Department’s move to expand liquidity-support buybacks for longer-dated government securities. The action helped ease some of the recent pressure on Treasury yields, providing support to rate-sensitive areas of the equity market.

Real estate’s 0.52% advance is consistent with the easing in long-term yield pressure, as lower borrowing costs tend to improve the relative outlook for the sector.

Technology Remains Under Pressure

Despite the broader market advance, technology continued to lag. The S&P 500 Information Technology sector fell 0.65%, helping explain why the Nasdaq was struggling to participate in the broader rally.

Industrials were the weakest sector, declining 0.71%. Financials fell 0.28% and energy slipped 0.16%, while utilities edged 0.11% higher.

Wednesday’s sector performance therefore points to a significant rotation beneath the headline indexes. Rather than technology leading the market, the S&P 500’s advance is being driven primarily by health care — amplified by the Moderna-Merck cancer breakthrough — alongside strength in consumer and materials stocks.
Post Image
US Stocks Rise as Treasury Bond-Market Support Eases Yield Pressure

U.S. stocks were mostly higher Wednesday as the Treasury Department’s expanded bond-buyback operations continued to support sentiment by easing pressure in the government debt market.

The S&P 500 was up 0.37% at 7,719.85, while the Dow Jones Industrial Average gained 0.46% to 53,588.62. The Nasdaq Composite, however, slipped 0.05% to 26,277.81, giving back its earlier gains as technology stocks lagged the broader market.

Treasury Intervention Brings Relief to Bonds and Stocks

The main catalyst supporting risk sentiment was Treasury Secretary Scott Bessent’s move to bolster liquidity in the Treasury market. The department said it would at least double the maximum size of liquidity-support buybacks for longer-dated Treasury securities, increasing operations from $2 billion to at least $4 billion and targeting the 10- to 30-year portion of the curve.

Bond yields dropped sharply following the announcement. The benchmark 10-year Treasury yield fell about 6 basis points to around 4.65%, while the 30-year yield declined roughly 9 basis points to around 5.20%. Treasury prices and yields move inversely.

The action has provided some relief after the recent surge in long-term borrowing costs became a major headwind for equities. The 30-year Treasury yield had climbed to around 5.34% on Tuesday, its highest level in nearly two decades, amid concerns over government borrowing, inflation, the U.S.-Iran conflict and elevated energy prices.

Dow Leads While Nasdaq Loses Momentum

The latest market action shows a divergence beneath the headline indexes. The Dow is now outperforming with a 0.46% gain, while the S&P 500 remains moderately higher. The Nasdaq has reversed its earlier advance and is trading slightly lower.

The reversal suggests that lower Treasury yields have not been enough to sustain the initial rebound in technology stocks. Growth and technology shares remain particularly sensitive to changes in long-term rates because higher yields reduce the present value of expected future earnings.

For the broader market, however, Treasury intervention has eased one of Wall Street’s most immediate concerns and helped stabilize financial conditions.

Investors will continue to monitor the Treasury market, oil prices and developments surrounding the U.S.-Iran conflict. The Federal Reserve’s July meeting minutes are also in focus for additional clues about the outlook for monetary policy, inflation and interest rates.
S&P 500 Falls as Technology and Industrials Lead Sector Selloff

U.S. stocks remained under pressure Tuesday afternoon, with the S&P 500 down 0.58% as weakness in technology and industrial shares outweighed strong gains across defensive and energy sectors.

Information Technology was the weakest S&P 500 sector, falling 1.93%, making it a major drag on the broader index given its heavy weighting. Industrials followed with a 1.30% decline, while Communication Services fell 0.59% and Materials lost 0.58%.

Investors Rotate Toward Defensive Sectors

The selloff was far from uniform. Health Care led the market with a 1.75% gain, followed by Energy at +1.61% and Consumer Staples at +1.29%. Financials also advanced 0.63%.

The divergence points to a defensive rotation as investors reduce exposure to growth-sensitive areas while favoring sectors typically considered more resilient during periods of uncertainty.

Energy’s strength also comes amid elevated oil prices as the continuing U.S.-Iran conflict keeps geopolitical risk and concerns about energy supplies in focus.

With technology falling nearly 2% while Health Care, Energy and Consumer Staples post sizable gains, Tuesday’s sector performance suggests risk appetite remains fragile even as parts of the market continue to outperform.
Post Image
U.S. Stocks Fall as Iran Conflict, Rising Oil Prices and Treasury Yields Pressure Markets

U.S. stocks traded lower Tuesday as the continuing U.S.-Iran conflict pushed oil prices higher and intensified concerns about inflation and interest rates, with technology stocks leading the decline.

The Nasdaq Composite fell 1.3% to 26,301, underperforming the broader market. The S&P 500 declined 0.49% to 7,707, while the Dow Jones Industrial Average was down 0.06% at 53,429.

The risk-off move comes as hopes for a lasting resolution to the U.S.-Iran conflict fade. Iran has shifted toward a more offensive military posture after efforts to negotiate a permanent end to the conflict stalled, while Washington declined to extend the temporary ceasefire.

Oil and Bond Yields Add Pressure

Energy markets remain one of the main channels through which the conflict is affecting U.S. equities. Brent crude rose for a third consecutive session Tuesday, trading around $91 per barrel and reaching its highest level in nearly three weeks as continued restrictions around the Strait of Hormuz raised concerns about global oil supplies.

Higher oil prices are feeding concerns that energy costs could keep inflation elevated, complicating the outlook for monetary policy.

Those concerns have spilled into the bond market. The U.S. 30-year Treasury yield climbed as high as 5.327%, its highest level since 2007, while the benchmark 10-year yield was also around 4.73%. The rise in long-term yields reflects a combination of inflation concerns related to the conflict and oil prices, alongside broader worries about U.S. borrowing and debt issuance.

The combination of higher energy prices and rising bond yields is particularly challenging for growth and technology stocks, helping explain the Nasdaq's sharper decline.

Latest U.S. Data Point to Softer Economic Momentum

Tuesday's economic releases added another layer of uncertainty.

U.S. housing starts dropped 12.4% month-over-month in July to an annualized 1.239 million units, well below expectations of 1.340 million and down sharply from 1.415 million previously.

Industrial production increased just 0.2% month-over-month in July, below the 0.3% forecast and previous reading. On a year-over-year basis, production growth slowed to 1.08% from 1.29%.

The labor market offered a somewhat stronger signal. Weekly ADP employment growth came in at 9,500 jobs, up from 8,300 previously.

Taken together, the data point to uneven economic momentum: employment continues to expand, but housing activity weakened sharply and industrial production grew more slowly than expected.

For Wall Street, however, geopolitics remains the dominant driver Tuesday. As long as the U.S.-Iran conflict keeps Brent crude elevated and pushes longer-term Treasury yields higher, pressure on equity valuations — particularly in the technology sector — is likely to remain a central market risk.
Post Image
S&P 500 Slips as Energy Leads While Consumer and Communication Stocks Weigh

U.S. stocks traded lower Monday afternoon, with weakness across consumer-related and communication services shares outweighing gains in energy and selected technology stocks.

The S&P 500 fell 0.31% to 7,761.71 as of around 1:21 p.m. ET, with seven of the index’s 11 major sectors trading in negative territory.

Energy was the strongest sector, rising 0.75%, as renewed U.S.-Iran tensions and uncertainty surrounding the Strait of Hormuz supported crude oil prices and energy shares. Industrials followed with a 0.42% gain, while health care added 0.09%.

Information technology was narrowly positive, up 0.06%, but the headline number masked substantial strength among semiconductor and memory stocks. Sandisk, Micron and Marvell were among the notable gainers as enthusiasm around AI infrastructure and memory demand continued to support chipmakers.

Consumer and Communication Stocks Lead Declines

Communication services was the session’s weakest S&P 500 sector, falling 1.54%. Consumer staples dropped 1.37%, while consumer discretionary declined 1.27%. Real estate, utilities, materials and financials also traded lower.

The weakness comes as investors remain cautious about the U.S. consumer following Friday’s disappointing retail-sales data, while markets await earnings from major retailers including Walmart, Target and Home Depot for additional evidence on household spending conditions.

Interest rates are also back in focus. The 10-year Treasury yield moved toward 4.70% after the New York Fed’s Empire State Manufacturing Index climbed to 20.6 in August, well above expectations of 10.6. The stronger economic reading adds another layer of uncertainty to the Federal Reserve outlook.

Monday’s sector performance shows a distinctly defensive and selective market rather than a broad selloff. Energy and AI-related semiconductor strength are providing support, but weakness across consumer-oriented sectors and communication services is keeping the S&P 500 in negative territory.
Post Image
U.S. Stocks Mixed as Strong Empire State Manufacturing Data Complicates Fed Outlook

U.S. stocks traded mixed Monday as investors weighed unexpectedly strong manufacturing data against continued strength in technology and AI-related shares.

The S&P 500 was down 0.14% at 7,774.51, while the Dow Jones Industrial Average fell 0.34% to 53,548.44. The technology-heavy Nasdaq bucked the trend, rising 0.13% to 26,764.38.

The New York Fed’s Empire State Manufacturing Index climbed to 20.6 in August from 15.6 in July, substantially exceeding the 10.6 market forecast and reaching its highest level in more than four years. New orders and shipments also recorded solid gains, pointing to stronger manufacturing activity in New York State.

The stronger report offered a positive signal for U.S. economic growth but also complicated the interest-rate outlook. Input-price pressures increased in the survey, potentially reinforcing concerns that the Federal Reserve may need to remain cautious about declaring inflation fully contained.

Technology stocks were providing support to the Nasdaq, with renewed strength in AI and semiconductor names helping the index outperform the broader market. Investors are also looking ahead to Wednesday’s Federal Reserve meeting minutes for additional clues on the policy outlook.

For Wall Street, the combination of resilient economic activity and easing inflation remains broadly constructive, but stronger growth and renewed price pressures could limit expectations for a more accommodative Fed.

The Best Five Sectors This Week #78

Julius de Kempenaer presents his weekly update on US sector rotation using Relative Rotation Graphs.

(articles.stockcharts.com)
U.S. Stocks Slip as Weak Retail Sales and Consumer Sentiment Raise Growth Concerns

U.S. stocks are trading modestly lower Friday after a weaker-than-expected batch of economic data raised fresh concerns about consumer demand and the near-term growth outlook.

The S&P 500 is down 0.07% at 7,793.67, while the Dow Jones Industrial Average is 0.18% lower at 53,741.48. The Nasdaq Composite is down 0.19% at 26,751.53.

Retail Sales Weaken in July

The main pressure comes from July retail sales. Headline retail sales fell 0.6% month over month, considerably weaker than the 0.1% increase expected by economists and reversing the previous month's 0.2% gain.

Core retail sales also disappointed, declining 0.3% compared with expectations for a 0.2% increase. The previous reading was a 0.2% decline.

The figures point to softer consumer spending momentum entering the second half of the year. Because household consumption remains a major driver of the U.S. economy, the downside surprise is reinforcing concerns that economic growth could lose some momentum.

Consumer Sentiment Falls as Inflation Expectations Rise

The University of Michigan's preliminary consumer sentiment index for August dropped to 51.0 from 55.2, well below the 54.7 consensus estimate.

Consumer expectations weakened as well, falling to 50.6 from 55.4 and missing expectations of 55.2.

At the same time, one-year inflation expectations increased to 4.3% from 4.2%. The combination of weaker confidence and slightly higher inflation expectations presents a less favorable macro backdrop: consumers are becoming more cautious while inflation concerns remain elevated.

Why Are U.S. Stocks Down?

Friday's data create a mixed signal for monetary policy. Weak retail spending and deteriorating consumer confidence strengthen the case for easier Federal Reserve policy, but the increase in short-term inflation expectations could complicate that outlook.

The relatively small declines across the S&P 500, Dow and Nasdaq suggest investors are not treating the data as evidence of a severe downturn. Instead, the market reaction reflects renewed caution over whether softer consumer demand could begin weighing more materially on corporate earnings and U.S. economic growth during the second half of 2026.
U.S. Stocks Rally as Softer PPI Supports Rate-Cut Hopes

U.S. stocks moved sharply higher Thursday as investors welcomed softer-than-expected producer inflation data, while labor-market figures offered a mixed but still relatively stable picture.

The Nasdaq led gains, rising 0.97% to 26,845.93, while the S&P 500 advanced 0.84% to 7,813.91. The Dow Jones gained 0.50% to 54,041.72.

The main catalyst was July's Producer Price Index. Headline PPI was unchanged month over month, below the 0.2% increase expected and following a 0.1% decline previously. Core PPI increased 0.2%, also below the 0.3% forecast and slowing from 0.4%.

The softer producer-price figures reinforced expectations that inflationary pressures in the production pipeline remain contained, potentially giving the Federal Reserve greater flexibility to lower interest rates.

Labor data were somewhat less supportive. Initial jobless claims rose to 209,000, above the 202,000 expected and 200,000 previously. However, continuing claims declined to 1.777 million, better than the 1.800 million forecast.

The combination of cooling producer inflation without clear evidence of severe labor-market deterioration created a favorable backdrop for equities. Technology stocks responded particularly strongly, helping the Nasdaq outperform as lower inflation expectations improved the outlook for interest-rate-sensitive growth valuations.
Video Thumbnail
08-21-26Global Finance News
Video Thumbnail
08-21-26Global Finance News
Video Thumbnail
08-20-26WS Investor
Video Thumbnail
08-19-26WS News
Video Thumbnail
08-19-26WS News

UK

Post Image
UK Services Growth Accelerates in August While Manufacturing Slows

UK business activity remained in expansion territory in August, led by stronger services growth.

The S&P Global Services PMI rose to 52.8 from 52.1, beating expectations of 51.8 and signaling an acceleration in the UK's dominant services sector.

Manufacturing was softer, with the PMI falling to 51.5 from 51.9 and slightly missing the 51.6 forecast. However, the reading remained above the 50 threshold, indicating continued expansion.

Overall, the data suggest resilient UK economic activity, with stronger services helping offset some loss of momentum in manufacturing.
Post Image
# UK Retail Sales Slow Sharply in July, Missing Forecasts

UK retail sales growth weakened significantly in July, pointing to softer consumer spending.

Headline retail sales rose 1.6% year over year, below the 2.2% forecast and sharply slower than the previous 3.8% increase.

Core retail sales, which exclude fuel, increased 2.3%, also missing expectations of 3.3% and slowing from 5.0% previously.

The weaker-than-expected figures suggest household demand lost momentum entering the second half of the year. For the Bank of England, softer consumption could reinforce concerns about economic growth and support a more cautious monetary-policy stance.
Post Image
UK Inflation Accelerates to 2.9% in July

UK inflation accelerated in July, adding to concerns that price pressures remain persistent despite signs of easing costs at the producer level.

The Consumer Price Index rose 2.9% year-over-year, matching market expectations but accelerating from 2.6% in June. On a monthly basis, consumer prices increased 0.3%, also in line with forecasts and above the previous 0.1% increase.

Producer-level pressures were considerably weaker. PPI input prices fell 1.7% month-over-month, compared with expectations for no change. The decline was slightly smaller than the previous month's 1.9% fall.

The combination presents a mixed inflation picture: businesses are seeing lower input costs, but consumer inflation is moving higher. For the Bank of England, the acceleration in headline CPI could reinforce a cautious approach toward monetary-policy easing, particularly if stronger consumer-price pressures persist in coming months.

Graph: Office for National Statistics UK
Post Image
UK Labor Market Sends Mixed Signals as Unemployment Holds at 4.9%

The UK labor market delivered mixed signals in the latest data, with unemployment remaining elevated even as the number of people claiming unemployment-related benefits declined.

The claimant count fell by 11,000 in July, considerably better than expectations for an increase of 16,500 and following a revised decline of 6,400 in the previous month.

Employment increased by 83,000 in the three months through June compared with the previous three-month period. However, the pace of employment growth slowed from 147,000 previously.

Meanwhile, the unemployment rate remained at 4.9% in June, slightly above the 4.8% market forecast and unchanged from the previous reading.

The figures suggest the UK labor market remains resilient but is gradually losing momentum. The unexpected decline in benefit claimants provides a positive signal, while slower employment growth and an unemployment rate near 5% point to softer underlying labor demand.

For the Bank of England, the mixed report keeps attention on whether cooling employment conditions will translate into weaker wage and inflation pressures, an important factor in determining the path of UK interest rates.
UK Retail Sales Growth Slows to 1% in July, Missing Expectations

UK retail sales growth weakened more than expected in July, adding to signs that consumers remain cautious despite support from summer spending and the World Cup.

The British Retail Consortium Retail Sales Monitor increased 1.0% year-over-year in July, below the 1.6% market forecast and slowing from 1.7% in June.
UK House Price Growth Slows Sharply in July as Market Stagnates

UK house prices were unchanged in July, highlighting continued weakness in the housing market as elevated borrowing costs and affordability pressures restrained demand.

The Lloyds House Price Index showed prices were flat at 0.0% month-on-month, below the 0.2% increase expected and following a 0.2% rise in June.

Annual house price growth slowed more sharply, falling to just 0.1% from a revised 0.7% in June and missing expectations for a 0.4% increase. This was the weakest annual growth rate since November 2023.
Eurozone and UK Services Activity Improves in July as Germany Returns to Near Stability

Services sector activity across Europe showed further signs of stabilization in July, with the Eurozone and the UK both posting stronger-than-expected PMI readings, while Germany's services sector moved closer to returning to expansion.

Key July Services PMI Results

Germany HCOB Services PMI: 49.8 (Expected: 49.6 | Previous: 48.6)
Eurozone HCOB Services PMI: 51.7 (Expected: 51.6 | Previous: 49.4)
UK S&P Global Services PMI: 52.1 (Expected: 51.8 | Previous: 48.8)
France HCOB Services PMI: 49.6 (Expected: 49.8 | Previous: 46.8)

The Eurozone services sector remained in expansion territory, with the PMI rising to 51.7, comfortably above the 50-point threshold that separates growth from contraction. The stronger-than-expected reading suggests demand across the region continued to recover despite lingering geopolitical uncertainty and softer manufacturing activity.

Germany also delivered an encouraging report. Although its services PMI remained just below the 50 mark at 49.8, the improvement from 48.6 indicates that the country's services sector is approaching stabilization after several months of weakness.

The UK posted one of the strongest reports among the major European economies. The Services PMI climbed to 52.1, beating expectations and rebounding sharply from 48.8 in June, pointing to renewed momentum in the country's largest economic sector.

France remained the weakest performer. While the Services PMI improved significantly from 46.8 to 49.6, it still stayed just below the expansion threshold, indicating that activity continues to contract, albeit at a much slower pace.

Overall, the July PMI releases suggest that Europe's services sector is becoming an increasingly important source of economic resilience. The data may ease concerns about slowing growth and reinforce expectations that domestic demand remains relatively healthy even as manufacturing continues to face headwinds.
UK House Price Growth Slows as Nationwide Index Misses Expectations

The UK housing market showed signs of cooling in July as annual house price growth slowed more than expected, suggesting higher borrowing costs and affordability pressures continue to weigh on property demand.

According to Nationwide, house prices rose 0.1% month over month in July, matching market expectations and improving from a flat reading in June. However, annual house price growth slowed to 1.8%, below economists' expectations of 1.9% and down from 2.2% in June.
Bank of England Holds Interest Rate at 3.75% as Expected

The Bank of England kept its benchmark interest rate unchanged at 3.75% on Thursday, matching market expectations and maintaining the policy rate at its current level.
UK Employment Growth Accelerates While Unemployment Holds Steady

The UK labor market showed renewed resilience in May as employment growth exceeded expectations while the unemployment rate remained stable, offering further evidence that hiring activity continues despite a slowing economy.

Employment increased by 147,000 on a three-month rolling basis, well above economists’ expectations for an 85,000 gain and accelerating from the previous increase of 100,000. The stronger-than-expected reading suggests employers continued to add workers despite elevated interest rates and a challenging economic environment.

Meanwhile, the unemployment rate held steady at 4.9%, matching both market expectations and the previous month’s reading. The stable unemployment rate indicates the labor market remains relatively tight even as economic growth moderates.

The latest employment figures come after recent UK economic data showed the economy returning to modest growth in May, while inflation has continued to ease. Together, the data points to an economy that remains resilient, although the Bank of England is likely to continue monitoring labor market conditions closely given their importance for wage growth and underlying inflation.

For policymakers, stronger employment growth could support a cautious approach to future interest rate decisions, particularly if wage pressures remain elevated. At the same time, moderating inflation may provide the Bank of England with greater flexibility over the coming months.

Investors will now focus on upcoming UK inflation and wage growth data for additional clues on the outlook for the labor market and the timing of future Bank of England policy moves.
Video Thumbnail
08-17-26WS Investor
Video Thumbnail
06-22-26WS Investor
Video Thumbnail
04-30-26Global Finance News
Video Thumbnail
04-30-26WS Investor
Video Thumbnail
03-19-26Global Finance News

Germany

Post Image
Eurozone Manufacturing Accelerates as Services Remain in Expansion

Eurozone business activity remained positive in August, with manufacturing showing a notable improvement.

The HCOB Manufacturing PMI climbed to 52.8 from 51.9, beating the 51.8 forecast and signaling a stronger expansion in factory activity.

The Services PMI held at 51.7, slightly above expectations of 51.5 and remaining comfortably above the 50 expansion threshold.

Overall, the data point to resilient Eurozone activity, with the manufacturing recovery gaining momentum while services continue to expand at a steady pace.
Post Image
German Manufacturing Strengthens in August, but Services Slip Into Contraction

Germany’s August PMI data showed a sharp divergence between manufacturing and services.

The HCOB Manufacturing PMI jumped to 54.1 from 52.2, well above the 52.1 forecast and signaling a stronger expansion in factory activity.

Services moved in the opposite direction. The Services PMI fell to 48.5 from 49.8, missing expectations of 50.1 and remaining below the 50 threshold separating expansion from contraction.

Overall, the strong manufacturing reading is encouraging for Germany’s industrial recovery, but renewed weakness in services suggests economic momentum remains uneven.
Post Image
German Producer Prices Jump 1.1% in July, Beating Expectations

German producer prices rose sharply in July, signaling renewed price pressures at the factory level and coming in well above market expectations.

Germany’s Producer Price Index (PPI) increased 1.1% month over month in July, compared with expectations for a 0.5% increase. The reading also marked a significant reversal from the 0.3% decline recorded in the previous month.

German PPI Beats Forecast

The latest figures showed:

* German PPI MoM: +1.1%
* Market forecast: +0.5%
* Previous: -0.3%
Eurozone Inflation Rises to 2.9% in July, Core CPI Climbs to 2.5%

Eurozone inflation accelerated in July, with both headline and core consumer price growth moving higher from the previous month, keeping inflation pressures above the European Central Bank’s 2% target.

Annual CPI inflation came in at 2.9% in July, matching market expectations but rising from 2.8% previously. Core CPI, which excludes more volatile components and is closely watched for underlying price pressures, increased to 2.5% from 2.4%, also in line with forecasts.

On a monthly basis, consumer prices rose 0.2% after declining 0.1% in the previous month.
Post Image
Eurozone Investor Sentiment Rises More Than Expected in August

Eurozone investor confidence improved further in August, adding to signs that expectations for the region’s economic outlook are gradually strengthening.

The ZEW Economic Sentiment Index rose to 31.4 in August from 23.4 previously, comfortably beating market expectations of 25.9. A reading above zero indicates that more surveyed analysts expect economic conditions to improve rather than deteriorate over the coming six months.

The stronger Eurozone reading coincides with a notable improvement in Germany, where the ZEW Economic Sentiment Index climbed to 34.2 from 26.3 and also exceeded expectations.

The latest figures suggest financial-market participants are becoming increasingly optimistic about the European economic outlook. The European Commission’s broader sentiment indicators had already shown improvement in July, with economic sentiment strengthening in both the EU and Eurozone.

Overall, the August ZEW reading provides another positive forward-looking signal for the Eurozone economy. However, improving expectations will still need to translate into stronger underlying business activity for confidence in a sustained economic recovery to strengthen.
Post Image
German Investor Sentiment Beats Expectations as Economic Outlook Improves in August

German investor confidence strengthened more than expected in August, offering a more encouraging signal for Europe’s largest economy even as assessments of current conditions remained deeply negative.

The ZEW Economic Sentiment Index climbed to 34.2 in August from 26.3 previously, beating market expectations of 30.1. The improvement suggests financial-market experts have become more optimistic about Germany’s economic prospects over the coming months.

The Current Conditions Index also improved substantially, rising to -61.1 from -77.6 and coming in well above the -68.8 forecast. Despite the improvement, the deeply negative reading indicates that Germany’s present economic environment remains weak.

The divergence between current conditions and expectations suggests investors are anticipating a recovery before it becomes clearly visible in underlying economic activity.

Overall, the August ZEW report provides a positive forward-looking signal for the German economy. Both indicators exceeded expectations, but the large gap between improving sentiment and still-poor current conditions suggests that expectations for recovery have yet to translate into a broad improvement in economic activity.
Eurozone Economy Expands 0.4% in Q2 as Growth Accelerates

The eurozone economy expanded by 0.4% quarter over quarter in the second quarter of 2026, matching market expectations and improving sharply from flat growth in the previous quarter.

On an annual basis, GDP increased 1.0%, also in line with expectations and accelerating from 0.5% growth in the first quarter.
Germany’s annual inflation rate accelerated to 2.8% in July, up sharply from 2.3% in June and matching the preliminary estimate. Consumer prices increased 0.8% month-over-month, also in line with expectations, reversing June’s 0.3% decline.

The acceleration was driven largely by energy prices, which rose 8.3% year-over-year in July compared with 3.4% in June. Core inflation, excluding food and energy, stood at 2.4%, indicating that the latest increase in headline inflation was particularly influenced by renewed energy-price pressures.

The figures reinforce concerns that the recent surge in oil and other energy costs linked to Middle East tensions could complicate the inflation outlook for Germany and the broader eurozone. The European Central Bank kept interest rates unchanged at its July meeting while retaining the option of further tightening as higher energy prices create renewed inflation risks.

With German inflation moving further above the ECB’s 2% target, the July data could strengthen the case for maintaining a restrictive monetary-policy stance, particularly if elevated energy prices persist in the coming months.
German Trade Surplus Narrows in June Despite Resilient Industrial Output

Germany’s trade surplus narrowed more than expected in June as a sharp rebound in imports offset solid export growth, while industrial production managed a modest monthly expansion.

According to data released Friday, Germany recorded a trade balance of **€15.4 billion** in June, falling short of the market consensus estimate of **€17.2 billion** and down from a revised **€19.4 billion** in May.

In a separate release, German **industrial production rose 0.2% month-on-month** in June, matching economic forecasts. While slower than May's revised 0.7% gain, the expansion was bolstered by steady output in the automotive sector. On an annual basis, industrial production registered a slight decline of 0.1%.

Economists note that while net exports and manufacturing show signs of short-term cyclical resilience, broader structural headwinds—including elevated energy costs, geopolitical supply disruption risks, and soft global demand—continue to cap Germany's medium-term growth potential.
German Factory Orders Surge in June, Beating Expectations

Germany's factory orders rose much more than expected in June, signaling a stronger recovery in manufacturing demand.

German Factory Orders (MoM, Jun)

Actual: 3.1%
Forecast: 0.5%
Previous: 0.3%
Video Thumbnail
01-27-26European Investor
Video Thumbnail
11-21-25WS News
Video Thumbnail
07-25-25WS Investor
Video Thumbnail
07-21-25WS News
Video Thumbnail
06-10-25The Investor

$ US

Gold, silver sharply down amid upticks in USDX, bond yields | Kitco News

The Kitco News Team brings you the latest news, videos, analysis and opinions regarding Precious Metals, Crypto, Mining, World Markets and Global Economy.

(kitco.com)

Yields up, dollar down - Deutsche Bank Research Institute

Geopolitics, technology, macro, corporate landscape – at home and abroad

(dbresearch.com)

The White House says it wants a strong US dollar. Investors are still keeping their distance.

As geopolitical turmoil has emanated from the US, world currencies have rallied while the dollar has flatlined.

(finance.yahoo.com)

Fiscal Fireworks: How Debt is Rewriting the Rules for the US and Japan | J.P. Morgan

Rising government debt worries fuel weakness in traditional safe-havens but bolster gold’s powerful rally as investors search for the home of the next crisis.

(jpmorgan.com)

Are We on the Brink of a Risk-Off Event? - Fat Tail Daily

Markets are starting to feel tense. Big swings across gold, copper, bitcoin, and currencies suggest the calm we’ve had may be fading.

(daily.fattail.com.au)

Vantagepoint AI Market Outlook for January 19, 2026

Welcome to the Artificial Intelligence Outlook for Forex trading. https://www.youtube.com/watch?v=gv6SEDEx5_w VIDEO TRANSCRIPT VANTAGEPOINT AI MARKET OUTLOOK Okay, hello everyone, and

(vantagepointsoftware.com)

AI-led growth story may not be enough for U.S. dollar strength in 2026 | Kitco News

The Kitco News Team brings you the latest news, videos, analysis and opinions regarding Precious Metals, Crypto, Mining, World Markets and Global Economy.

(kitco.com)

Vantagepoint AI Market Outlook for December 22, 2025

Welcome to the Artificial Intelligence Outlook for Forex trading. https://www.youtube.com/watch?v=eseGCepSKZE VIDEO TRANSCRIPT VANTAGEPOINT AI MARKET OUTLOOK

(vantagepointsoftware.com)

Vantagepoint AI Market Outlook for December 8, 2025

Market outlook for the week ...

(vantagepointsoftware.com)

Why the Dollar Could Drop | Goldman Sachs

why the dollar could drop

(goldmansachs.com)
Video Thumbnail
08-21-26Global Finance News
Video Thumbnail
08-21-26Global Finance News
Video Thumbnail
08-17-26WS News
Video Thumbnail
08-13-26Global Finance News
Video Thumbnail
07-24-26WS News

France

Post Image
Eurozone Manufacturing Accelerates as Services Remain in Expansion

Eurozone business activity remained positive in August, with manufacturing showing a notable improvement.

The HCOB Manufacturing PMI climbed to 52.8 from 51.9, beating the 51.8 forecast and signaling a stronger expansion in factory activity.

The Services PMI held at 51.7, slightly above expectations of 51.5 and remaining comfortably above the 50 expansion threshold.

Overall, the data point to resilient Eurozone activity, with the manufacturing recovery gaining momentum while services continue to expand at a steady pace.
Post Image
France Manufacturing Rebounds in August While Services Contract Further

France’s private-sector data sent mixed signals in August, with manufacturing improving while services weakened.

The HCOB Manufacturing PMI rose to 51.5 from 49.8, comfortably beating the 50.1 forecast and moving above the 50 threshold that separates expansion from contraction.

In contrast, the Services PMI fell to 48.4 from 49.6, missing expectations of 49.4 and signaling a deeper contraction in France’s much larger services sector.

Overall, the strong manufacturing rebound is encouraging, but continued services weakness suggests France’s broader economic recovery remains fragile.
Eurozone Inflation Rises to 2.9% in July, Core CPI Climbs to 2.5%

Eurozone inflation accelerated in July, with both headline and core consumer price growth moving higher from the previous month, keeping inflation pressures above the European Central Bank’s 2% target.

Annual CPI inflation came in at 2.9% in July, matching market expectations but rising from 2.8% previously. Core CPI, which excludes more volatile components and is closely watched for underlying price pressures, increased to 2.5% from 2.4%, also in line with forecasts.

On a monthly basis, consumer prices rose 0.2% after declining 0.1% in the previous month.
Post Image
Eurozone Investor Sentiment Rises More Than Expected in August

Eurozone investor confidence improved further in August, adding to signs that expectations for the region’s economic outlook are gradually strengthening.

The ZEW Economic Sentiment Index rose to 31.4 in August from 23.4 previously, comfortably beating market expectations of 25.9. A reading above zero indicates that more surveyed analysts expect economic conditions to improve rather than deteriorate over the coming six months.

The stronger Eurozone reading coincides with a notable improvement in Germany, where the ZEW Economic Sentiment Index climbed to 34.2 from 26.3 and also exceeded expectations.

The latest figures suggest financial-market participants are becoming increasingly optimistic about the European economic outlook. The European Commission’s broader sentiment indicators had already shown improvement in July, with economic sentiment strengthening in both the EU and Eurozone.

Overall, the August ZEW reading provides another positive forward-looking signal for the Eurozone economy. However, improving expectations will still need to translate into stronger underlying business activity for confidence in a sustained economic recovery to strengthen.
Eurozone Economy Expands 0.4% in Q2 as Growth Accelerates

The eurozone economy expanded by 0.4% quarter over quarter in the second quarter of 2026, matching market expectations and improving sharply from flat growth in the previous quarter.

On an annual basis, GDP increased 1.0%, also in line with expectations and accelerating from 0.5% growth in the first quarter.
French Inflation Rebounds 0.6% in July, Matching Forecasts

French consumer prices rose 0.6% month over month in July 2026, matching market expectations and reversing the 0.3% decline recorded in June. France’s EU-harmonized HICP also increased 0.6% during the month, in line with forecasts.

The rebound was driven largely by higher services prices, including seasonal increases in transportation and accommodation, alongside rising energy costs. On an annual basis, headline CPI accelerated to 2.1% from 1.8%, while HICP inflation increased to 2.4% from 2.0%.
Eurozone and UK Services Activity Improves in July as Germany Returns to Near Stability

Services sector activity across Europe showed further signs of stabilization in July, with the Eurozone and the UK both posting stronger-than-expected PMI readings, while Germany's services sector moved closer to returning to expansion.

Key July Services PMI Results

Germany HCOB Services PMI: 49.8 (Expected: 49.6 | Previous: 48.6)
Eurozone HCOB Services PMI: 51.7 (Expected: 51.6 | Previous: 49.4)
UK S&P Global Services PMI: 52.1 (Expected: 51.8 | Previous: 48.8)
France HCOB Services PMI: 49.6 (Expected: 49.8 | Previous: 46.8)

The Eurozone services sector remained in expansion territory, with the PMI rising to 51.7, comfortably above the 50-point threshold that separates growth from contraction. The stronger-than-expected reading suggests demand across the region continued to recover despite lingering geopolitical uncertainty and softer manufacturing activity.

Germany also delivered an encouraging report. Although its services PMI remained just below the 50 mark at 49.8, the improvement from 48.6 indicates that the country's services sector is approaching stabilization after several months of weakness.

The UK posted one of the strongest reports among the major European economies. The Services PMI climbed to 52.1, beating expectations and rebounding sharply from 48.8 in June, pointing to renewed momentum in the country's largest economic sector.

France remained the weakest performer. While the Services PMI improved significantly from 46.8 to 49.6, it still stayed just below the expansion threshold, indicating that activity continues to contract, albeit at a much slower pace.

Overall, the July PMI releases suggest that Europe's services sector is becoming an increasingly important source of economic resilience. The data may ease concerns about slowing growth and reinforce expectations that domestic demand remains relatively healthy even as manufacturing continues to face headwinds.
France Inflation Rebounds Sharply in July, Exceeding Expectations

France's inflation picked up sharply in July, with both the national Consumer Price Index (CPI) and the Harmonized Index of Consumer Prices (HICP) rising more than expected, pointing to renewed price pressures at the start of the third quarter.

France's CPI increased 0.6% month over month in July, double the market expectation of 0.3% and marking a sharp rebound from the 0.3% decline recorded in June. The country's HICP, the measure used for eurozone inflation comparisons, also rose 0.6% on a monthly basis, beating forecasts of 0.3% after falling 0.3% in the previous month.
French Economy Returns to Growth in Q2 as Quarterly GDP Meets Expectations

France's economy expanded 0.2% quarter-over-quarter in the second quarter, matching market expectations and rebounding from a 0.1% contraction in the previous quarter. On an annual basis, GDP grew 0.7%, slightly below economists' forecasts of 0.8% and down from 0.8% in the first quarter.

The quarterly rebound suggests the French economy regained modest momentum after a weak start to the year, although the softer annual growth rate indicates that overall economic activity remains subdued.
Eurozone Inflation Eases Further in June, Supporting ECB Policy Outlook

Eurozone inflation continued to moderate in June, reinforcing expectations that the European Central Bank will have greater flexibility to continue easing monetary policy if disinflation remains on track.

Headline consumer inflation came in at 2.8% year over year, matching market expectations and slowing from 3.2% in May. Core inflation, which excludes volatile food and energy prices, also met forecasts at 2.4%, down from 2.6% in the previous month.
Video Thumbnail
02-03-26WS News
Video Thumbnail
01-27-26European Investor
Video Thumbnail
11-21-25WS News
Video Thumbnail
10-07-25WS News
Video Thumbnail
05-27-25Global Finance News

Japan

Japan Inflation Edges Higher as Services Activity Strengthens

Japan’s economic data showed a modest pickup in inflation alongside stronger services activity in August.

National core CPI rose 1.8% year over year in July, matching expectations and accelerating from 1.6% previously. Headline consumer prices increased 0.4% month over month, slightly faster than the previous 0.3% rise.

Meanwhile, the S&P Global Services PMI climbed to 52.3 in August from 51.2, indicating a stronger expansion in Japan’s services sector.

Overall, the figures point to gradually firmer inflation and resilient domestic activity. The combination could support expectations that the Bank of Japan will maintain a cautious path toward further monetary-policy normalization.
Japan Trade Deficit Widens in July but Beats Expectations

Japan recorded a trade deficit of ¥634.5 billion in July, widening sharply from the revised ¥409.9 billion deficit in the previous month.

Despite the deterioration, the result was slightly better than market expectations for a ¥680.0 billion deficit.
Post Image
Japan’s Economy Slows in Q2 as GDP Growth Misses Expectations

Japan’s economy expanded at a slower-than-expected pace in the second quarter, signaling softer economic momentum.

GDP grew 0.3% quarter-over-quarter in Q2, below the 0.5% forecast and slowing from 0.5% in the previous quarter. On an annual basis, GDP increased 1.1%, also missing expectations for 2.0% growth and easing from 1.9% previously.

Meanwhile, the GDP price index rose 2.6% year-over-year, above the 2.4% forecast but down from 3.2% in the previous quarter.

The data present a mixed picture for the Bank of Japan. Persistent price pressures support the case for further monetary policy normalization, while weaker-than-expected economic growth could encourage policymakers to remain cautious about the timing and pace of additional rate increases.
Japan Current Account Swings Into Deficit in June, Missing Expectations

Japan's current account weakened sharply in June, with the unadjusted balance unexpectedly moving into deficit and the adjusted surplus coming in well below market expectations.

The non-seasonally adjusted current account recorded a ¥92 billion deficit, compared with expectations for a ¥1.512 trillion surplus. That marked a dramatic deterioration from the ¥3.968 trillion surplus reported in the previous month.

The seasonally adjusted current account remained in surplus but also weakened significantly, falling to ¥1.40 trillion from ¥3.06 trillion. Economists had expected a considerably stronger ¥2.50 trillion surplus.

The weaker-than-expected figures point to a significant deterioration in Japan's external balance during June. While monthly current-account data can be volatile, the magnitude of the shortfall relative to expectations could draw attention to changes in Japan's trade flows, overseas investment income and import costs.

For markets, the data provide a softer signal for the Japanese economy and could factor into expectations for the yen and Bank of Japan policy, particularly alongside upcoming inflation, wage and growth indicators.
Japan Household Spending Falls Sharply in June, Missing Expectations

Japanese household spending weakened significantly in June, raising concerns about the strength of domestic consumption.

* Household Spending (YoY): -3.3%
* Forecast: +0.8%
* Previous: -0.4%
* Household Spending (MoM): -6.4%
* Forecast: -3.1%
* Previous: +3.7%

Household spending fell 3.3% from a year earlier, sharply missing expectations for a return to growth. On a monthly basis, spending dropped 6.4%, more than twice the expected decline and reversing May’s 3.7% increase.

The figures suggest Japanese consumers remained cautious despite improving wages, potentially reflecting continued pressure from higher living costs. Weak household demand could become a concern for Japan’s broader economic recovery, given the importance of consumption to domestic growth.

For markets, the unexpectedly weak data may slightly reduce expectations for near-term monetary tightening by the Bank of Japan. That could put some pressure on the yen while providing support for Japanese equities, particularly if investors expect monetary conditions to remain accommodative for longer.
Japan Services PMI Falls More Than Expected in July as Services Sector Growth Slows

Japan's services sector expanded for the fourth consecutive month in July, although growth lost momentum more than expected.

The S&P Global Japan Services PMI came in at 51.2, below the 51.9 market consensus and down from 52.2 in June. While the reading remains above the 50-point threshold that separates expansion from contraction, it signals that activity in the country's services sector continued to slow during the month.
Bank of Japan Holds Interest Rates Steady as Expected

The Bank of Japan left its benchmark interest rate unchanged at 1.00% on Thursday, in line with market expectations, as policymakers continued to assess the impact of previous rate hikes and the outlook for inflation and economic growth.
Japan's Core Inflation Accelerates, Industrial Output Beats Expectations

Japan's economy showed encouraging signs at the start of Friday's Asian session as both inflation and industrial production exceeded market expectations, reinforcing the view that domestic economic conditions remain resilient.

Tokyo Core Consumer Price Index (CPI), a key leading indicator for nationwide inflation, rose 1.9% year over year in July, above economists' expectations of 1.8% and accelerating from 1.6% in June. The stronger reading suggests underlying inflationary pressures remain firm in Japan's capital and supports expectations that price growth is becoming more sustainable.

Meanwhile, industrial production increased 1.3% month over month in June, outperforming forecasts for a 1.0% increase and rebounding sharply from May's 0.1% gain. The stronger-than-expected production data points to improving manufacturing activity despite ongoing uncertainty surrounding global trade and exports.
BoJ Core CPI Holds Steady at 2.7%, Supporting Expectations for a Cautious Policy Path

Japan's core inflation remained unchanged in the latest reading, with the Bank of Japan's Core CPI rising 2.7% year over year, matching both market expectations and the previous month's figure.

The stable reading suggests underlying inflationary pressures remain resilient but are no longer accelerating. With inflation continuing to stay above the Bank of Japan's 2% target, policymakers are likely to maintain a gradual approach toward further monetary policy normalization rather than rushing to tighten financial conditions.
Japan's Industrial Production Misses Expectations in May

Japan's industrial production rose modestly in May but fell short of market expectations, highlighting continued weakness in the country's manufacturing sector.

Industrial production increased 0.1% month over month in May, below economists' expectations for a 0.5% increase. The reading also slowed from the 0.5% growth recorded in April.
Video Thumbnail
08-12-26WS Investor
Video Thumbnail
06-16-26Global Finance News
Video Thumbnail
05-23-26Global Finance News
Video Thumbnail
05-11-26WS Investor
Video Thumbnail
05-08-26Global Finance News

NASDAQ:BIDU

Uber Launches Baidu Driverless Robotaxis in Dubai

Uber Technologies (NYSE: UBER) and Baidu (NASDAQ: BIDU) have launched fully driverless Apollo Go robotaxis on Uber’s platform in Dubai, marking the first commercial deployment under their multi-year autonomous-vehicle partnership.

Starting August 20, riders requesting UberX or Uber Comfort in select areas of Umm Suqeim and Jumeirah may be matched with Baidu’s autonomous vehicles. Customers can also select an “Autonomous” option in the Uber app to increase their chances of receiving a robotaxi.

Dubai Becomes Launchpad for Global Expansion

The service uses Baidu’s sixth-generation RT6, a purpose-built electric robotaxi equipped with more than 30 sensors. Dubai is expected to serve as the starting point for plans to deploy thousands of Apollo Go vehicles across Uber’s global network.

Baidu said Apollo Go now operates across 28 cities and has accumulated more than 350 million autonomous kilometers, including over 240 million kilometers without a human driver.

For Uber, the launch advances its strategy of becoming the distribution platform for autonomous mobility rather than developing its own self-driving technology. Uber now works with more than 30 autonomous-vehicle partners, allowing competing AV developers to access its large ride-hailing network.

The Dubai deployment is therefore strategically important for both companies: Baidu gains international distribution for Apollo Go, while Uber strengthens its position as a marketplace connecting autonomous fleets with riders.
Baidu Stock Falls 7.3% as Weak Advertising Revenue Overshadows AI Growth

Baidu (NASDAQ: BIDU) shares fell about 7.3% after the Chinese technology company reported second-quarter results that highlighted strong momentum in its AI businesses but continued weakness in its traditional online marketing operations.

Total revenue declined 4% year-over-year to RMB31.3 billion, while Baidu General Business revenue also fell 4% to RMB25.2 billion. The company's legacy online marketing business remained under pressure, with online marketing revenue dropping 19% from a year earlier to RMB13.1 billion. Baidu's net income attributable to shareholders was RMB2.3 billion, with diluted earnings per ADS of RMB5.74.

AI Businesses Continue to Expand

The weaker share price came despite impressive growth in Baidu's AI operations, which management now describes as the core of the company's long-term strategy.

Revenue from Baidu Core AI-powered Business reached RMB12.5 billion, accounting for roughly half of Baidu General Business revenue. AI Cloud Infrastructure revenue rose 50% year-over-year to RMB7.3 billion, while GPU Cloud revenue surged 283%, accelerating from 184% growth in the previous quarter.

AI Applications revenue increased 3% to RMB2.5 billion, while Apollo Go continued expanding internationally, launching fully driverless commercial operations in Dubai and conducting testing in London, Hong Kong, Switzerland and other markets.

Legacy Business Still Weighs on Results

Investors appeared to focus on the continued deterioration in Baidu's legacy internet business. Legacy business revenue declined 23% year-over-year, while total Baidu General Business revenue slipped 4%.

Although Baidu generated positive operating cash flow for a fourth consecutive quarter and maintained RMB283.1 billion in cash and investments, the sharp decline in advertising revenue suggests the company's transition from an internet-centric business to an AI-first company is still underway rather than complete.

The 7.3% selloff therefore appears to reflect investor concern that rapid AI growth is not yet large enough to fully offset weakness in Baidu's traditional advertising operations. While GPU Cloud and AI infrastructure continue to post exceptional growth rates, markets are likely looking for clearer evidence that those businesses can translate into sustained overall revenue and earnings growth as the legacy business contracts.
Baidu Shares Edge Higher as AI Business Crosses Historic Threshold in Q1 2026

Baidu's stock ticked up 0.81% today after the company reported its first quarter 2026 earnings, a modest but telling market response to results that showed the company's artificial intelligence business reaching a symbolic milestone for the first time.

The headline number was a structural one. Revenue from Baidu's Core AI-powered Business exceeded RMB 13.6 billion in Q1, rising 49% year over year, and for the first time crossed the threshold of representing more than half of Baidu General Business revenue. Robin Li, co-founder and CEO, framed it plainly: AI has become the core driver of Baidu.

The engine behind the quarter was AI Cloud Infrastructure, with revenue reaching RMB 8.8 billion, up 79% year over year, and GPU Cloud revenue climbing 184% over the same period. AI-native Marketing Services brought in RMB 2.3 billion, up 36%, while AI Applications came in at RMB 2.5 billion, roughly flat year over year.

Total revenue came in at RMB 32.1 billion, or approximately $4.65 billion. Net income attributable to Baidu was RMB 3.4 billion, with diluted earnings per ADS of $1.27, or $1.75 on a non-GAAP basis. Operating cash flow remained positive at RMB 2.7 billion, which CFO Haijian He pointed to as a sign of improving operational efficiency.

Apollo Go delivered 3.2 million fully driverless rides in Q1, up more than 120% year over year, with cumulative public rides now exceeding 22 million across 27 cities globally. ERNIE 5.1, launched in May 2026, ranked first among Chinese models on the LMArena text leaderboard and fourth globally.

The 0.81% gain reflects a market that sees Baidu's AI transformation as real but not surprising, with the stock having already appreciated significantly heading into the report.
Baidu and Uber announced a new phase of their global partnership to launch Baidu’s Apollo Go autonomous ride-hailing service in Dubai, in collaboration with Dubai Roads and Transport Authority.

The fully autonomous service is expected to launch within the coming month, initially operating in selected areas of Jumeirah. Rides will be bookable through the Uber app, where users may be matched with an Apollo Go vehicle when selecting UberX, Uber Comfort, or an “Autonomous” option. Fleet operations will be managed by third-party operator New Horizon, with expansion across Dubai dependent on regulatory approvals and operational performance.

The initiative supports Dubai’s strategic objective of making 25% of all transportation trips autonomous by 2030. It also follows earlier announcements to expand Apollo Go to London and the opening of Apollo Go Park in Dubai, Baidu’s first overseas operations and management hub.

Apollo Go is one of the world’s largest autonomous ride-hailing services, with more than 240 million autonomous kilometers logged globally, over 140 million of which were completed in fully driverless mode. The service operates across 22 cities, exceeds 250,000 weekly rides, and has completed more than 17 million cumulative trips as of late 2025.

Source: Business Wire
Baidu Stock Surges ~12% on AI Chip Spin-Off and Analyst Support

Shares of Baidu climbed sharply today, rising around 12% as investors welcomed major strategic developments tied to the company’s artificial-intelligence business. According to Investors*com, Baidu’s jump was triggered by news that its AI chip unit Kunlunxin has filed confidentially for an IPO on the Hong Kong Stock Exchange, a move seen as unlocking standalone value for the fast-growing chip division.

The proposed spin-off drew strong market interest because it aligns with China’s broader push to strengthen domestic semiconductor capabilities amid ongoing U.S. export restrictions on advanced chips, Reuters reported today. The IPO-related optimism boosted demand for Chinese tech shares overall, with Baidu leading gains among U.S.-listed Chinese stocks.

Analyst support added to the positive momentum. According to Investing*com, Jefferies raised its price target on Baidu to $181 from $159 while maintaining a Buy rating, citing the spin-off as a catalyst that could enhance investor focus on both Baidu and Kunlunxin’s growth potential.
Baidu and Uber Partner to Launch Autonomous Rides Outside U.S. and China

Baidu and Uber have announced a multi-year strategic partnership to deploy Baidu’s Apollo Go autonomous vehicles on the Uber platform in global markets outside the U.S. and mainland China. Initial launches are expected later this year in Asia and the Middle East. Apollo Go, with over 1,000 driverless vehicles and 11 million public rides to date, will help Uber expand its affordable and reliable ride options. The partnership leverages Baidu’s autonomous tech and Uber’s vast mobility network to scale AV adoption worldwide.
Video Thumbnail
01-13-26European Investor

NYSE:UBER

Uber Launches Baidu Driverless Robotaxis in Dubai

Uber Technologies (NYSE: UBER) and Baidu (NASDAQ: BIDU) have launched fully driverless Apollo Go robotaxis on Uber’s platform in Dubai, marking the first commercial deployment under their multi-year autonomous-vehicle partnership.

Starting August 20, riders requesting UberX or Uber Comfort in select areas of Umm Suqeim and Jumeirah may be matched with Baidu’s autonomous vehicles. Customers can also select an “Autonomous” option in the Uber app to increase their chances of receiving a robotaxi.

Dubai Becomes Launchpad for Global Expansion

The service uses Baidu’s sixth-generation RT6, a purpose-built electric robotaxi equipped with more than 30 sensors. Dubai is expected to serve as the starting point for plans to deploy thousands of Apollo Go vehicles across Uber’s global network.

Baidu said Apollo Go now operates across 28 cities and has accumulated more than 350 million autonomous kilometers, including over 240 million kilometers without a human driver.

For Uber, the launch advances its strategy of becoming the distribution platform for autonomous mobility rather than developing its own self-driving technology. Uber now works with more than 30 autonomous-vehicle partners, allowing competing AV developers to access its large ride-hailing network.

The Dubai deployment is therefore strategically important for both companies: Baidu gains international distribution for Apollo Go, while Uber strengthens its position as a marketplace connecting autonomous fleets with riders.
Post Image
Uber Stock Jumps 5.5% as Citigroup Reiterates Market Outperform Rating

Uber Technologies (NYSE: UBER) shares are up about 5.5% after Citigroup reiterated its Market Outperform rating on the ride-hailing and delivery company, adding to positive investor sentiment around the stock.

The bullish rating reinforces confidence in Uber’s position as a global leader in mobility and food delivery. The company’s scale, extensive driver and customer network, and improving profitability give it a strong competitive position within the transportation technology sector.

Uber is also increasingly positioned as a potential beneficiary of autonomous driving rather than simply facing it as a competitive threat. The company has been building partnerships with autonomous-vehicle developers, seeking to use its large mobility platform as a distribution network for robotaxi services as the technology expands.

The 5.5% gain suggests investors are responding positively to the reiterated bullish analyst view, with Uber’s improving financial profile, dominant mobility platform and longer-term autonomous vehicle opportunity supporting sentiment.
Uber Partners With Zipline to Scale Drone Delivery Across U.S., Targets 1 Million Deliveries a Day

Uber Technologies (NYSE: UBER) announced a major strategic partnership with autonomous drone delivery company Zipline on Monday, aiming to bring drone-based Uber Eats deliveries to millions of U.S. consumers.

The first deployments are expected to begin later in 2026, allowing customers in supported markets to receive Uber Eats orders through Zipline’s autonomous drones. The companies plan to expand the service across dozens of U.S. cities.

More significantly, Uber and Zipline are targeting one million drone deliveries per day by the end of 2029, signaling ambitions to make autonomous delivery a meaningful part of Uber’s logistics network rather than a limited pilot program.

Uber will also make a strategic investment in privately held Zipline, although the size of the investment was not disclosed.

Uber Expands Its Autonomous Delivery Strategy

The partnership strengthens Uber’s push toward a hybrid delivery network combining human couriers, sidewalk robots and drones. Using autonomous delivery for suitable orders could eventually reduce delivery times and costs while expanding the capacity of the Uber Eats network.

Zipline already has significant operating experience. The company operates across four continents, has completed more than 2.7 million deliveries and has flown over 135 million autonomous commercial miles. Its technology is designed to deliver orders within approximately five to 10 minutes.

For Uber, the agreement provides access to an established drone platform without requiring the company to develop the underlying aviation technology itself. At the same time, Zipline gains access to Uber Eats’ large consumer and merchant network.

The scale of the 2029 target makes the partnership strategically significant for Uber. If successfully deployed across major U.S. markets, drones could become another important component of the company’s broader effort to automate portions of its delivery network and improve the economics of last-mile logistics.
Uber and Pony*ai Expand Robotaxi Partnership With Plan for More Than 2,000 Vehicles in Europe

Uber Technologies (NYSE: UBER) and Pony*ai (NASDAQ: PONY) are expanding their autonomous-driving partnership, with plans to deploy more than 2,000 Pony*ai robotaxis across Europe as the companies move toward larger-scale commercialization of driverless transportation.

The expanded partnership builds on the companies’ existing project in Zagreb, Croatia, where Pony*ai robotaxis are expected to become available through the Uber platform. The companies now plan to expand into four additional European cities, with further deployment also planned for the Middle East.

The names of the additional European cities and the rollout timetable have not yet been disclosed.

Partnership Targets Commercial Robotaxi Scale

Under the agreement, Pony*ai will provide its Level 4 autonomous-driving technology and robotaxi operating expertise, while Uber will provide its mobility platform, including customer access, booking, payments and customer service.

Local fleet partners may handle vehicle ownership and daily operations depending on the market. This structure could allow Uber and Pony*ai to expand without either company necessarily financing and operating the entire fleet itself.

The companies said the strategy is designed to move autonomous mobility beyond individual pilot programs toward repeatable, commercially scalable deployments.

Pony*ai already operates paid, fully driverless robotaxi services in four major Chinese cities and said it has reached city-wide breakeven unit economics in multiple markets. That experience could provide an important foundation as the company expands its technology internationally.

Uber Builds Out Autonomous Mobility Network

The announcement further strengthens Uber’s strategy of positioning its platform as a distribution network for autonomous vehicles rather than developing its own autonomous-driving system.

It also follows Uber’s separate announcement this week of plans for a robotaxi pilot in Tokyo using Nissan LEAF vehicles equipped with Wayve’s AI Driver technology.

For Uber, adding more than 2,000 Pony*ai vehicles would represent a meaningful expansion of autonomous vehicles available through its platform and could strengthen its position as robotaxi operators increasingly seek established ride-hailing networks to reach customers.

For Pony*ai, meanwhile, the agreement provides access to Uber’s large customer base and established mobility infrastructure, potentially accelerating its expansion outside China.
# Uber Expands Robotaxi Push with Tokyo Pilot Planned for Late 2026

Uber Technologies (NYSE: UBER) is advancing its autonomous mobility strategy in Japan through a new operational partnership with Hinomaru Kotsu for a robotaxi pilot scheduled to launch in Tokyo in late 2026.

The program builds on Uber’s March 2026 robotaxi agreement with Nissan and autonomous-driving technology company Wayve. The pilot will use Nissan LEAF vehicles equipped with Wayve’s AI Driver technology, while rides will be available through Uber’s ride-hailing platform.

## Uber Builds Local Operating Model for Robotaxis

Hinomaru Kotsu will handle the physical fleet operations required for the service, including vehicle maintenance, inspections, cleaning, charging, depot management and vehicle availability.

The structure is particularly important in Japan because passenger transportation must be provided by authorized taxi operators. Uber will supply the matching platform and operational tools, while Hinomaru Kotsu will act as the licensed fleet operator.

The initial rollout will not be fully driverless. Experienced Hinomaru Kotsu drivers will remain behind the wheel as safety operators, with fully autonomous operations potentially introduced later subject to regulatory approval.

For Uber, the Tokyo project represents another step toward positioning its platform as an aggregation layer for autonomous vehicles rather than relying exclusively on human drivers. Partnerships with automakers, autonomous-driving developers and established fleet operators could allow Uber to expand robotaxi services without developing its own autonomous-driving system.

Tokyo also provides a demanding test environment because of its dense urban infrastructure and complex traffic conditions. A successful deployment could strengthen Uber's position as autonomous mobility moves from limited testing toward commercial ride-hailing applications.

The partnership could also address Japan's persistent driver shortages over the longer term, while giving Uber an additional route to expand its presence in a market where local transportation regulations have historically constrained traditional ride-hailing models.
Uber Stock Rises 2.8% as Jefferies Raises Price Target to $110

Uber Technologies (NYSE: UBER) shares rose about 2.8% Monday after Jefferies raised its price target on the ride-hailing and delivery company while maintaining a Buy rating.

Jefferies analyst John Colantuoni increased the firm's price target on Uber to $110 from $100. Based on the stock's recent price of about $76.82, the new target implies roughly 43% potential upside.

Jefferies Maintains Bullish View on Uber

The $10 increase in the price target reinforces Jefferies' positive stance on the company. Unlike a rating upgrade, Monday's analyst action maintains the existing Buy recommendation but increases the valuation Jefferies believes Uber shares can support.

The move is particularly notable following recent volatility in Uber shares, as investors continue to assess the company's growth prospects alongside longer-term questions surrounding autonomous vehicles and their potential impact on the ride-hailing industry.

Uber has increasingly positioned itself as a platform that could benefit from autonomous vehicles rather than simply compete against them, establishing partnerships designed to bring robotaxi services onto its network.

Investors will now be watching Uber's mobility and delivery growth, profitability and free cash flow, as well as progress in autonomous-driving partnerships. For Monday's session, however, the Jefferies target increase is providing a clear positive catalyst for UBER shares.
Uber (UBER) Stock Falls 6% Despite Strong Q2 Earnings and Record Cash Flow

Uber Technologies (NYSE: UBER) shares fell around 6% on Wednesday despite reporting another quarter of strong growth in bookings, earnings, and cash flow. While the ride-hailing and delivery giant delivered solid financial results and maintained healthy guidance for the third quarter, investors appeared disappointed that revenue growth was slower than bookings growth and that the outlook did not include a significant upside surprise.

Gross Bookings Reach a New High

Uber delivered another quarter of robust operating performance, with growth across all of its major business segments.

Key second-quarter results included:

* Gross Bookings: $58.0 billion (+24% year over year; +22% constant currency)
* Revenue: $14.2 billion (+12%)
* Trips: 3.87 billion (+18%)
* Monthly Active Platform Consumers: 208 million (+16%)
* Adjusted EBITDA: $2.82 billion (+33%)
* Non-GAAP Operating Income: $2.14 billion (+40%)
* Non-GAAP EPS: $0.81 (+35%)
* Free cash flow: $2.79 billion (+13%)

The company also reported GAAP operating income of $1.9 billion and GAAP diluted EPS of $1.17, supported in part by a $1.6 billion pre-tax gain from the revaluation of its equity investments.

Delivery and Freight Continue to Lead Growth

Uber's Delivery segment remained one of the company's strongest performers.

Delivery revenue increased 28%, while Gross Bookings climbed 26%. Freight also posted solid results, with both revenue and Gross Bookings rising 25%.

Meanwhile, Mobility Gross Bookings increased 22%, reflecting continued healthy demand for ride-hailing services. However, Mobility revenue rose just 1%, largely due to business model changes that affected reported revenue growth despite higher customer activity.

Management noted that these changes reduced overall reported revenue growth by approximately eight percentage points during the quarter.

Profitability Continues to Improve

Uber continued to demonstrate strong operating leverage.

Adjusted EBITDA increased 33% to $2.82 billion, while Non-GAAP Operating Income climbed 40% to $2.14 billion. The company also generated $2.79 billion in free cash flow during the quarter, pushing trailing twelve-month free cash flow above $10 billion for the first time in its history.

CEO Dara Khosrowshahi highlighted Uber's expanding ecosystem, noting that the company added more first-time users over the past twelve months than during any comparable period in the past five years. He also emphasized Uber's long-term strategy of building the world's largest platform for autonomous vehicles.

Third-Quarter Outlook Remains Strong

For the third quarter of 2026, Uber expects:

* Gross Bookings between $58.25 billion and $60.25 billion, representing constant-currency growth of 18% to 22%.
* Non-GAAP EPS between $0.84 and $0.88.
* Adjusted EBITDA between $2.86 billion and $2.96 billion.

The guidance points to another quarter of strong profitability and continued demand across Uber's platform.

Why the Stock Fell

Despite reporting impressive growth across most operating metrics, investors appeared disappointed by the company's 12% reported revenue growth, which lagged the 24% increase in Gross Bookings. Although management explained that business model changes reduced reported revenue growth by roughly eight percentage points, the market may have been hoping for stronger top-line acceleration.

In addition, Uber's third-quarter guidance was broadly in line with expectations rather than significantly above them. After a series of consistently strong quarterly reports, investors may have viewed the latest results as solid but lacking a meaningful positive surprise, leading to profit-taking following the earnings release.

Wednesday's results demonstrated that Uber continues to generate strong growth across mobility, delivery, and freight while expanding profitability and producing record levels of cash flow.
Uber Surges 7% as Platform Growth Accelerates and Earnings Scale at Twice the Topline Rate

May 6, 2026 · Earnings Report

Uber Technologies jumped 7% today after reporting a first quarter that demonstrated the company's growing grip on daily consumer life, with trips, bookings, and earnings all expanding at a pace that comfortably exceeded expectations.

Gross bookings grew 25% year-over-year to $53.7 billion, or 21% on a constant currency basis, marking the third consecutive quarter of growth exceeding 21%. Trips grew 20% to 3.6 billion, driven by monthly active platform consumers rising 17% to 199 million. Revenue came in at $13.2 billion, up 14% year-over-year, though the headline figure was held back by roughly 9 percentage points due to business model changes.

The profitability story was arguably more impressive than the top line. GAAP income from operations surged 57% to $1.9 billion, non-GAAP operating income grew 42% to $1.9 billion, and adjusted EBITDA rose 33% to $2.5 billion. Non-GAAP EPS jumped 44% to $0.72. GAAP net income came in at just $263 million, significantly below the prior year's $1.78 billion, but that decline was entirely due to a $1.5 billion non-cash headwind from revaluations of Uber's equity investments rather than any operational weakness. Free cash flow was $2.3 billion for the quarter and the company ended March with $6.1 billion in unrestricted cash.

The Delivery segment was the standout growth driver, with gross bookings up 28% to $26.0 billion and revenue surging 34% to $5.1 billion. Mobility gross bookings rose 25% to $26.4 billion. Both segments expanded operating income meaningfully, with Mobility up 28% to $2.0 billion and Delivery up 43% to $961 million. Freight remained a modest drag, posting a small operating loss of $30 million.

A key milestone highlighted by CEO Dara Khosrowshahi was the platform reaching 50 million Uber One members, with subscribers now accounting for half of gross bookings across Mobility and Delivery, underscoring the stickiness and monetization power of the membership model.

"We are off to an exceptional start to 2026, with Gross Bookings growth exceeding 21% for the third consecutive quarter and earnings scaling at more than twice our topline," said CFO Balaji Krishnamurthy.

For the second quarter, Uber guided gross bookings to between $56.25 billion and $57.75 billion, representing 18% to 22% constant currency growth, and non-GAAP EPS of $0.78 to $0.82, implying growth of 31% to 38% year-over-year. Adjusted EBITDA is expected to reach between $2.70 billion and $2.80 billion.
Uber Technologies and Block Inc. announced an expanded global partnership aimed at improving restaurant operations and payment options across Uber’s platforms. The collaboration will extend Square’s integration with Uber Eats to multiple international markets, while introducing Cash App Pay as a payment method for Uber and Uber Eats users in the United States.

The partnership is designed to streamline restaurant workflows through integrated ordering systems and enhance customer payment flexibility, including access to millions of Cash App users. The companies said the initiative builds on previous collaborations and reflects a broader effort to connect their ecosystems and support growth for merchants and consumers globally.

Source: Uber
Prosus N.V. announced it has sold a 4.5% stake in Delivery Hero SE to Uber Technologies, Inc. for approximately €270 million.

The transaction involved the sale of 13.6 million shares at €20.00 each, representing a roughly 22% premium to the one-month volume-weighted average price. The deal forms part of Prosus’ commitments to the European Commission following its acquisition of Just Eat Takeaway*com, requiring a reduction in its Delivery Hero stake.

Prosus stated it remains committed to further reducing its shareholding within the agreed timeframe.
Video Thumbnail
08-19-26WS Investor
Video Thumbnail
08-18-26WS News
Video Thumbnail
08-06-26European Investor
Video Thumbnail
07-27-26WS News

US Funds

Nasdaq Slides as Chip Sell-Off Accelerates, Dragging Semiconductor ETFs and AI Leaders Lower

The Nasdaq came under heavy selling pressure on Thursday after a relatively resilient start to the session, with semiconductor stocks leading a broad technology retreat. While the Dow Jones remained in positive territory, the Nasdaq fell more than 1.4% as investors aggressively sold chipmakers following their exceptional first-half rally.

The weakness was widespread across the semiconductor industry. Micron Technology (MU) dropped more than 7%, while SanDisk (SNDK) plunged over 15%, extending a sharp pullback that began after both companies posted massive year-to-date gains. Other major chip names, including Nvidia (NVDA), Advanced Micro Devices (AMD), Broadcom (AVGO) and Western Digital (WDC) also traded lower as investors continued rotating out of AI infrastructure stocks.

The sell-off was equally visible in sector exchange-traded funds. The iShares Semiconductor ETF (SOXX) fell roughly 7%, while the VanEck Semiconductor ETF (SMH) lost nearly 6%, highlighting broad-based weakness rather than company-specific concerns. The decline suggests investors are taking profits across the semiconductor sector after one of its strongest first-half performances on record.

Analysts point to a combination of factors behind the retreat, including profit-taking after extraordinary gains, concerns that AI-related chip valuations had become stretched, and signs that investors are rotating toward other parts of the technology sector. Recent reports suggesting cloud providers could optimize AI infrastructure spending have also fueled concerns that the pace of semiconductor demand growth may moderate, even as the long-term AI investment theme remains intact.

Despite Thursday’s sharp decline, many Wall Street analysts continue to view the move as a healthy correction rather than a change in the industry’s long-term outlook, arguing that AI-driven demand for advanced chips and memory products remains robust over the coming years.
State Street Investment Management launched the State Street IG Public & Private ABS ETF (PRAB), an actively managed exchange-traded fund designed to give investors broader exposure to investment-grade asset-backed securities across both public and private markets.

The fund invests in securities such as collateralized loan obligations (CLOs) and residential and commercial mortgage-backed securities, aiming to provide diversified income opportunities and potentially higher yields compared with corporate bonds of similar risk.

State Street said the ETF responds to growing investor demand for access to the global asset-backed finance market, which exceeds $20 trillion but remains underrepresented in traditional bond portfolios.
Business Wire
State Street Investment Management has expanded its MyIncome ETF lineup with the launch of five actively managed high yield corporate bond target maturity ETFs, adding to what it calls the industry’s first actively managed corporate target maturity ETF suite.

The new funds — My2027 (MYHA), My2028 (MYHB), My2029 (MYHC), My2030 (MYHD) and My2031 (MYHE) High Yield Corporate Bond ETFs — provide exposure to high yield bonds with matching maturity years from 2027 through 2031. The ETFs are designed to help investors build bond ladders that manage interest rate risk while offering predictable income and liquidity.

Managed by the firm’s fixed income team, the funds aim to maximize yield while preserving capital and managing liquidity, sector and issuer concentration risks. Each ETF is structured to distribute remaining principal and liquidate around December 15 of its respective maturity year. As of January 31, 2026, assets under management in the MyIncome suite totaled $298 million.

Source:Business Wire

Sector Momentum Favors Defense; QQQ Yet To Break; Split NDX Breadth

The stock market is clearly in defensive mode but QQQ is still holding up, and its long-term breadth still hasn't turned bearish. Arthur Hill's analysis identifies the key levels to watch.

(articles.stockcharts.com)
State Street Investment Management has launched the **State Street Prime Money Market ETF (MMK)**, an actively managed ETF designed to provide flexible, transparent, and cost-effective cash management.

The ETF aims to maximize current income while preserving capital and liquidity, investing in short-term, high-quality debt instruments such as U.S. government securities, certificates of deposit, commercial paper, asset-backed securities, mortgage-related securities, and repurchase agreements.

With an expense ratio of **18 basis points**, MMK is among the lowest-cost active prime money market ETFs in the U.S. As of December 31, 2025, State Street’s cash team managed approximately **$599.55 billion** in assets.

Source: Business Wire.

VantagePoint A.I. Asset of the Week iShares Silver Trust ($SLV) - VantagePoint $SLV

This week's ai asset spotlight is the iShares Silver Trust ($SLV) On December 3, 2025, we put $SLV front and center as our Asset of the Week and made one thing crystal clear: silver was no

(vantagepointsoftware.com)
I collected my first dividend from the FDVV ETF this week. It was not much—just $12—but it felt good to see the portfolio start to generate cash. Over time, I expect these payments to grow.

I am also spending time researching QQQI. It is a relatively new ETF and clearly carries more risk, especially since it focuses on large technology companies that may be somewhat overvalued right now. Still, I plan to allocate a small portion of my portfolio to it. The annual yield of around 13% is attractive, and I believe the tech and AI rally is likely to continue for at least another couple of years. If that plays out, QQQI could contribute meaningfully to overall returns.
Blackrock multi asset income monthly commentary ...

(blackrock.com)
State Street launches lowest-cost leveraged loan ETF in the U.S.

State Street Investment Management introduced the State Street SPDR S&P Leveraged Loan ETF (LVLN), giving investors broad, index-based exposure to the expanding leveraged loan market. With a 0.40 percent gross expense ratio, LVLN is now the lowest-cost leveraged loan ETF available in the U.S., according to Bloomberg data as of November 18, 2025.

The fund tracks the S&P USD Select Leveraged Loan Index, which includes U.S. dollar–denominated loans of at least 500 million dollars and applies issuer, facility and industry caps for diversified coverage. State Street says demand for leveraged loans continues to grow as investors seek income and low correlation to Treasuries and investment-grade corporate bonds.

The launch expands State Street’s fixed-income ETF lineup to include both active and index strategies targeting the rapidly growing loan segment.
Video Thumbnail
08-21-26Global Finance News
Video Thumbnail
08-20-26WS Investor
Video Thumbnail
08-18-26Global Finance News
Video Thumbnail
08-15-26The Investor
Video Thumbnail
08-14-26WS Investor

Gold

Post Image
Gold Jumps 1.7% as U.S. Treasury Bond Buyback Plans Support Safe-Haven Demand

Gold prices climbed sharply on Friday, rising 1.67% to around $4,647.60, as investors reacted to the U.S. Treasury’s decision to significantly expand its purchases of longer-dated government bonds.

The Treasury announced that it will at least double the maximum size of its liquidity-support buybacks for 10- to 30-year Treasury securities to $4 billion per operation from $2 billion. The expanded program will begin September 9 and remain in place through November 4. Treasury said the move is intended to provide greater liquidity support in longer-dated parts of the bond market.

The announcement initially pushed long-term Treasury yields lower. The 30-year yield, which had recently reached 5.34% — its highest level since 2007 — declined following the announcement. Lower bond yields generally support gold because they reduce the opportunity cost of holding the non-interest-bearing metal.

The move has also pressured the U.S. dollar. The dollar index was heading for a weekly decline of about 0.9% and traded near a three-month low as some investors questioned whether increasingly aggressive Treasury intervention could ultimately weaken confidence in U.S. assets. A softer dollar makes dollar-denominated gold cheaper for international buyers.

However, Treasury's program should not be confused with Federal Reserve quantitative easing. The Treasury is essentially repurchasing older long-dated securities as part of its debt-management and liquidity operations rather than creating money to purchase bonds. At $4 billion per operation, the purchases also remain small relative to the enormous U.S. Treasury market.

Gold's 1.7% advance therefore appears to reflect a combination of lower-yield expectations, dollar weakness and renewed concerns about the U.S. fiscal outlook. With federal debt now above $40 trillion and long-term yields remaining historically elevated, investors are increasingly watching whether Treasury could expand its intervention further if bond-market pressure persists.
Post Image
Gold Holds Above $4,550 as Iran Tensions and Lower Treasury Yields Support Demand

Gold prices edged higher on Thursday, holding near recent highs as escalating U.S.-Iran tensions continued to support demand for defensive assets, while lower U.S. Treasury yields provided an additional tailwind for the precious metal.

December gold futures were trading around $4,551.30 per ounce in early U.S. trading, up $6.00, or 0.13%, after fluctuating between gains and losses earlier in the session.

The relatively modest move follows a much stronger rally in gold during the previous session, leaving prices near their highest levels in more than two months.

U.S.-Iran Economic Conflict Adds to Safe-Haven Demand

Geopolitical uncertainty remains an important source of support for gold after U.S. President Donald Trump announced a major escalation of economic pressure against Iran.

Trump warned that countries providing Iran with financial, commercial or other economic support could face significant economic consequences as Washington seeks to further isolate Tehran. The announcement comes as the broader U.S.-Iran conflict continues and uncertainty over the Strait of Hormuz remains elevated. (Reuters)

The escalation is also supporting oil prices, increasing concerns about the inflationary consequences of prolonged disruption to Middle Eastern energy supplies. Brent crude climbed to a three-week high on Thursday amid continued concerns about regional supply.

For gold, the situation creates competing forces. Greater geopolitical uncertainty can increase safe-haven demand, while higher oil prices can raise inflation expectations and potentially keep interest rates elevated.

Treasury Move and Falling Yields Support Gold

Another important factor behind gold's recent strength has been the sharp move in the U.S. bond market.

The U.S. Treasury announced that it would increase the size of its liquidity-support buyback operations for longer-term government bonds. The announcement helped push long-term Treasury yields lower and weakened the U.S. dollar, creating a more favorable environment for gold.

Gold typically benefits from falling yields because the metal does not generate interest. A weaker dollar can also make dollar-denominated gold more attractive to international buyers.

The impact was particularly visible on Wednesday, when gold surged more than 4% as Treasury yields fell and the dollar weakened.

Gold Consolidates After Sharp Rally

Thursday's relatively small 0.13% gain therefore represents more of a consolidation than a fresh breakout.

After such a strong move in the previous session, some profit-taking is limiting further gains. Spot gold had earlier reached a two-month high before retreating as investors locked in profits.

December futures nevertheless remain above the psychologically important $4,500 area, suggesting that underlying demand remains firm despite the intraday volatility.

What to Watch for Gold

Gold's next direction will likely depend on three interconnected factors: the U.S.-Iran conflict, Treasury yields and expectations for Federal Reserve monetary policy.

Further escalation between Washington and Tehran could strengthen safe-haven demand, particularly if U.S. economic measures lead to additional disruption in Iran's oil trade or the Strait of Hormuz.

At the same time, investors will closely monitor the bond market. A continued decline in Treasury yields and further dollar weakness would generally favor gold, while another sharp increase in yields could limit upside momentum.

For now, gold is holding near $4,550 after its recent rally, with geopolitical uncertainty and lower yields providing support while profit-taking prevents a more aggressive advance.
Gold Jumps More Than 2% as Treasury Bond Buybacks Send Yields Lower

Gold prices surged Wednesday after the U.S. Treasury announced plans to significantly expand its purchases of longer-dated government debt, triggering a sharp decline in Treasury yields and improving the appeal of non-yielding assets such as gold.

December gold futures climbed about 2.2% to around $4,517 an ounce, reversing earlier weakness and moving above the psychologically important $4,500 level.

Treasury Action Triggers Sharp Gold Rally

The move accelerated after the Treasury said it would at least double the maximum size of its liquidity-support buybacks for longer-dated securities, from $2 billion to at least $4 billion. The operations will target the 10- to 30-year portion of the Treasury market, which has recently faced significant selling pressure.

Treasury yields fell sharply following the announcement. The 10-year yield dropped about 6 basis points to roughly 4.65%, while the 30-year yield fell around 9 basis points to approximately 5.20%.

That is particularly supportive for gold because bullion does not pay interest. Falling government-bond yields reduce the opportunity cost of holding gold, making the precious metal relatively more attractive.


The combination of lower Treasury yields, potentially easier financial conditions and persistent geopolitical uncertainty therefore appears to explain the sudden acceleration in gold.

Investors will next focus on the Federal Reserve's July meeting minutes. Any signal that reduces expectations for higher interest rates could provide additional support for gold, while a renewed rise in long-term Treasury yields would remain one of the principal risks to the rally.
Post Image
Gold Slips Below $4,420 as Investors Await Fed Minutes

Gold prices edged lower Wednesday as investors remained focused on U.S. interest rates and the upcoming Federal Reserve meeting minutes, while persistent Middle East tensions continued to provide underlying safe-haven support.

December U.S. gold futures were trading around $4,413 per ounce, down about 0.17%. Despite the latest decline, gold is roughly flat over the past five sessions after experiencing considerable volatility.

Treasury Yields Remain Key for Gold

Gold came under significant pressure Tuesday as a global bond selloff pushed long-term borrowing costs toward multi-decade highs. Higher yields typically weigh on bullion because gold does not pay interest. U.S. Treasury yields have since eased, helping stabilize the precious metal.

Attention now turns to minutes from the Federal Reserve's July meeting, due later Wednesday. Investors will look for signals about policymakers' assessment of inflation, economic growth and the future path of interest rates. Recent softer U.S. economic data have reduced expectations for additional Fed tightening, providing some support for gold.

Meanwhile, the continuing U.S.-Iran conflict remains an important counterweight. Uncertainty surrounding the Strait of Hormuz has kept Brent crude above $91, sustaining geopolitical risk as well as concerns that elevated energy prices could prolong inflationary pressures.

For gold, the near-term direction is therefore being shaped by competing forces: geopolitical uncertainty is supporting safe-haven demand, while elevated bond yields continue to limit the appeal of the non-yielding metal. The Fed minutes could provide the next major catalyst for bullion prices.
Post Image
Gold Falls Below $4,450 as Stronger Dollar and Higher Yields Offset Middle East Risks

Gold prices fell on Tuesday, retreating below $4,450 per ounce as a stronger U.S. dollar and elevated Treasury yields outweighed safe-haven demand generated by renewed tensions between the U.S. and Iran.

December gold futures were trading around $4,448.80 per ounce in early U.S. trading, down approximately 0.56%. Gold briefly approached $4,460 earlier in the session before reversing lower.

Dollar and Treasury Yields Pressure Gold

The decline comes as investors reassess the outlook for U.S. monetary policy following stronger economic data. Monday’s Empire State Manufacturing Index jumped to 20.6 in August from 15.6, substantially exceeding expectations of 10.6 and signaling resilient manufacturing activity.

The stronger economic backdrop has helped support the dollar and kept Treasury yields elevated, creating pressure for gold. Because bullion provides no interest income, higher bond yields increase the opportunity cost of holding the precious metal.

Markets are now awaiting the Federal Reserve’s July meeting minutes for further indications of how policymakers view inflation, economic growth and the path for interest rates.

Geopolitical Risks Limit the Decline

Gold’s losses remain relatively contained despite the negative interest-rate backdrop because geopolitical risks in the Middle East remain elevated. U.S.-Iran diplomacy has stalled, while continued disruption to shipping through the Strait of Hormuz has pushed Brent crude back above $91 per barrel.

That environment continues to provide underlying safe-haven support for bullion, even as the stronger dollar and higher yields dominate Tuesday’s trading.

The near-term direction for gold is therefore being shaped by two opposing forces: persistent geopolitical uncertainty supporting demand and a resilient U.S. economy keeping monetary conditions relatively restrictive. A sustained move below $4,440 could signal additional short-term weakness, while renewed geopolitical escalation or falling Treasury yields could quickly restore buying interest.

Central Bank Gold Reserves By Country | Map | BullionVault

Post Image
Which countries have the largest gold reserves? Here we share the top 10 central banks buying the most gold bullion with a map of the gold holdings by nation around the world >>

(bullionvault.com)
Post Image
Gold Price Rises Above $4,450 as Weaker Dollar and Fed Outlook Support Demand

Gold prices moved higher on Monday, extending their recent recovery as a weaker U.S. dollar and fading expectations for another near-term Federal Reserve rate hike supported demand for the precious metal.

December gold futures were trading around $4,450–$4,456 per ounce in early U.S. trading, up roughly 0.3% on the session. Gold briefly climbed above $4,470 earlier in the day before giving back part of its gains.

Softer U.S. Data Weighs on the Dollar

The main support for gold continues to come from changing expectations around U.S. monetary policy. Recent weakness in U.S. employment and retail sales, alongside relatively moderate inflation data, has reduced expectations that the Federal Reserve will raise interest rates again in September.

Middle East Risks Add Safe-Haven Support

Geopolitical uncertainty is also helping keep demand for gold elevated. Tensions remain high around the Strait of Hormuz, continued uncertainty surrounding the U.S.-Iran conflict keeping investors alert to further escalation.

The combination of a softer dollar, lower rate-hike expectations and persistent geopolitical risks leaves the near-term backdrop supportive for gold. Attention now turns to the Federal Reserve’s July meeting minutes for further clues on the direction of U.S. monetary policy.

A sustained move above $4,500 would represent the next important psychological test for gold, while renewed dollar strength or a shift back toward more hawkish Fed expectations could limit further gains.
Post Image
Gold price last week
Gold Rallies More Than 11% in a Month as Weak U.S. Data, Fed Expectations and Geopolitical Risks Boost Demand

Gold has staged a powerful rebound over the past month, with December 2026 futures trading around $4,437 per ounce, up roughly 11.3% over the period. The contract recently approached $4,500, reflecting a combination of softer U.S. economic data, changing Federal Reserve expectations and persistent geopolitical uncertainty.

The latest U.S. data added another layer of support. July retail sales unexpectedly fell 0.6% month over month, the first decline in nine months and the largest in more than a year. The weakness reinforced concerns that consumer spending and economic momentum may be cooling.

Inflation data have also become more supportive for precious metals. U.S. consumer prices increased just 0.1% in July, while annual inflation eased to 3.4% from 3.5% in June. The combination of softer inflation and weaker consumption has reduced expectations for additional Federal Reserve tightening. Markets currently assign only around a 30% probability to a September rate increase.

Geopolitical Risks Add Safe-Haven Support

Gold’s rebound has also developed against a highly uncertain geopolitical backdrop. Tensions surrounding Iran and the Strait of Hormuz have kept energy markets volatile and maintained demand for defensive assets. Earlier in August, gold was trading near $4,030 as markets reacted to changing expectations surrounding U.S.-Iran developments.

The softer U.S. dollar has provided an additional tailwind. Gold and other precious metals strengthened late last week as weak retail-sales data reduced expectations for higher U.S. interest rates and pressured the dollar.

What to Watch

The move toward $4,500 represents a significant recovery after gold’s sharp correction earlier this year. Despite the recent rally, bullion remains well below the record levels reached in January, highlighting how much volatility remains in the market.

The next direction will likely depend heavily on U.S. economic data and Federal Reserve communication. Continued evidence of slowing growth and easing inflation could support gold by limiting the case for further rate increases. Conversely, renewed inflation pressure—particularly through elevated energy prices—or a more hawkish Fed could lift Treasury yields and the dollar, creating resistance around the recent $4,500 area.

Graph: yahoofinance*com

China's Gold Investing Outweighs Jewelry 2.5x | Gold News

Gold investing demand in China topped jewellery purchases 2.5 times by weight in the first half of 2026 new data show >>

(bullionvault.com)
Video Thumbnail
08-13-26The Investor
Video Thumbnail
08-13-26Global Finance News
Video Thumbnail
08-07-26WS News
Video Thumbnail
08-06-26European Investor
Video Thumbnail
08-03-26WS News